
Realistic data, simulated systems, proven at scale.
Every team knows the feeling: the code is ready, but the release is waiting on a vendor sandbox, a shared staging environment, or a test account someone else controls. ZMeter removes that wait. It recreates the behaviour of the systems you depend on, runs your tests against them whenever you like, and gives you a verdict you can show to anyone who needs to sign off.
- Run any time. No booking a sandbox, no queueing for staging.
- Know before you ship. Every run ends in a verdict, not a pile of logs.
- Show your work. A per-record ledger and exportable evidence for every release.
02 · Before & after
Same pipeline. No more waiting in line.
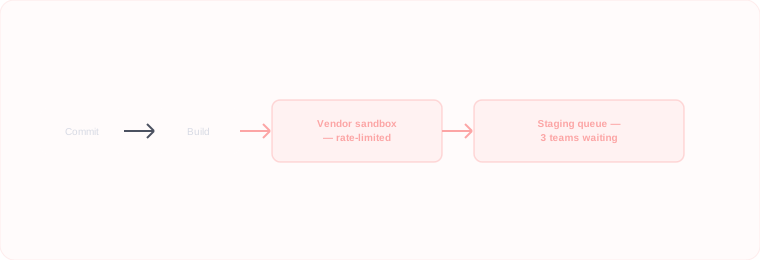
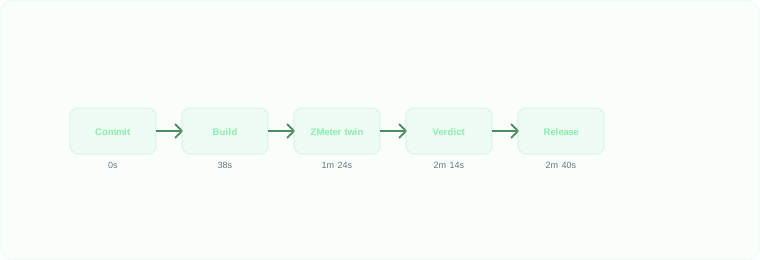
Most release pipelines look healthy on paper and stall in practice. The slowdowns rarely sit in your own code. They sit at the edges: third-party sandboxes that behave differently from production, shared environments that several teams are using at once, and systems you can only reach on someone else's schedule. Here is the same pipeline, before and after.
Before ZMeter
After ZMeter
Sandboxes that don't behave like production. Limited data, rate caps and drift mean a green test proves very little.
Shared staging that everyone fights over. One team's test run breaks another team's release.
Releases that wait on someone else. Every dependency you can't control becomes a delay you can't plan.
03 · Platform
Four pillars. One platform to take a release from idea to evidence.
ZMeter is one platform with four connected pillars. Each pillar answers a question your team already asks before every release: what are we testing against, what are we throwing at it, what could go wrong, and can we prove it was fine. Use them together, or start with the one that solves your biggest bottleneck today.
PILLAR 1
Design
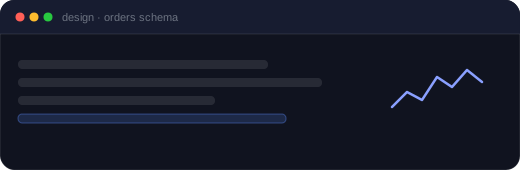
- Scenarios: build data journeys visually, or describe them in plain language.
- Data Studio: relationship-consistent synthetic data from any schema.
- Deterministic seeds, so a failure can be reproduced exactly.
What changes for your team: Instead of waiting for access to the real system, you start from a twin you control, shaped to match how the real one behaves. New joiners reuse what's already built, so knowledge doesn't live in one engineer's head.
PILLAR 2
Drive
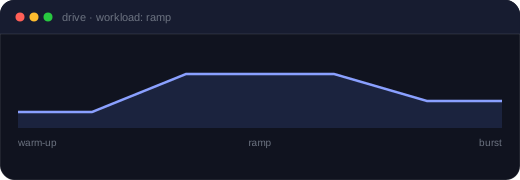
- Workloads: warm-up, ramp and burst profiles, with guardrails and auto back-off.
- Live runs into real pipelines.
- DST-safe schedules for continuous regression.
What changes for your team: Test data stops being a bottleneck. Scenarios are written once and replayed on every build, so coverage grows with each release and not with each person's spare time.
PILLAR 3
Simulate
- Enterprise simulators for ServiceNow, Okta, ERP, CRM and cloud systems.
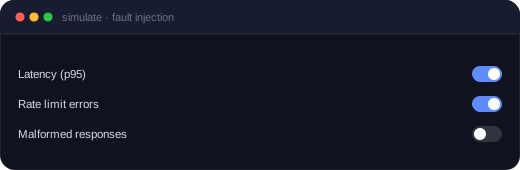
- Fault injection: rate limits, errors and latency, on demand.
- On-demand simulators per run. Record and replay is coming soon.
What changes for your team: The failures that used to surface in production — timeouts, partial responses, unexpected data — are found in testing, where fixing them is cheap. Teams can run in parallel without stepping on each other.
PILLAR 4
Prove
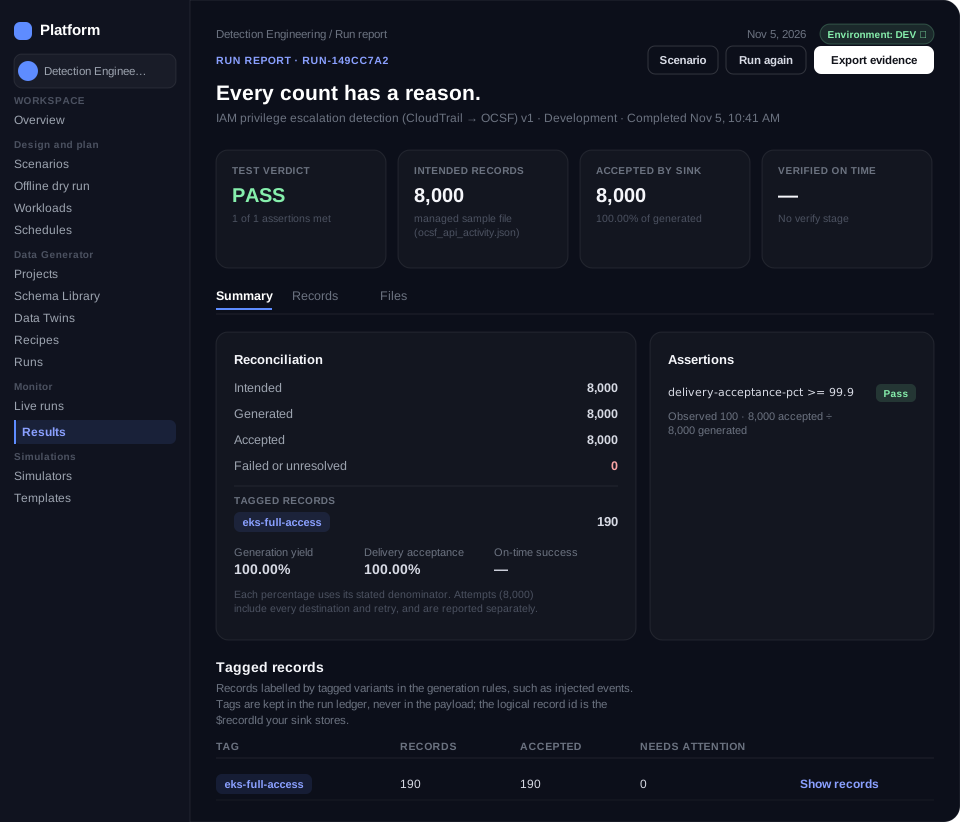
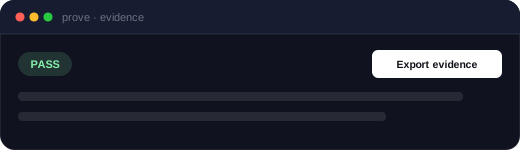
- Run reports with a clear PASS or FAIL verdict.
- A generated vs accepted vs verified ledger, per record.
- Evidence export for audit and release sign-off.
What changes for your team: "It passed" becomes "here is exactly what passed, record by record." Release sign-off, audits and post-incident reviews all start from the same evidence, instead of screenshots and recollection.
04 · How it works
From connection to verdict in four steps.
Most release pipelines look healthy on paper and stall in practice. The slowdowns rarely sit in your own code. They sit at the edges: third-party sandboxes that behave differently from production, shared environments that several teams are using at once, and systems you can only reach on someone else's schedule. Here is the same pipeline, before and after.
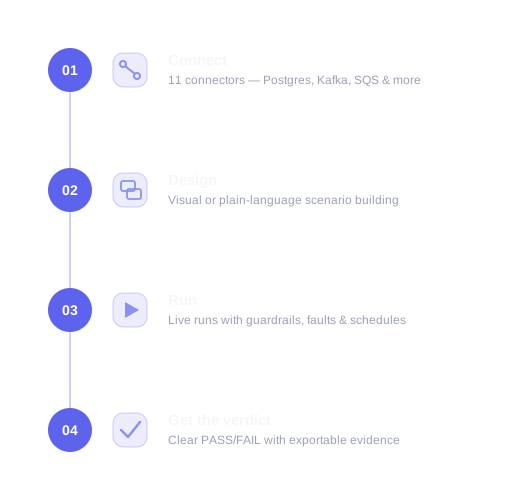
Connect
Point ZMeter at your schema and the systems your release depends on — databases, message queues, HTTP or SFTP endpoints. 11 connectors, including PostgreSQL, Kafka and Amazon SQS.
Design
Build scenarios visually or in plain language. Data Studio generates the data, deterministic seeds make failures reproducible, and simulators like ServiceNow and Okta stand in for systems you can't test against.
Run
Start a live run with a workload profile (warm-up, ramp or burst), guardrails and auto back-off. Add faults like rate limits, errors and latency, or schedule runs to repeat.
Get the verdict
Every run ends in a clear PASS or FAIL, with a per-record ledger of what was generated, accepted and verified. Export the evidence or compare it with the next run.
05 · Platform
Four pillars. One platform to take a release from idea to evidence.
ZMeter is one platform with four connected pillars. Each pillar answers a question your team already asks before every release: what are we testing against, what are we throwing at it, what could go wrong, and can we prove it was fine. Use them together, or start with the one that solves your biggest bottleneck today.
1 · Release without waiting on sandboxes
Scenario: A team has a release ready, but the vendor sandbox is down for maintenance and shared staging is booked for two days. With ZMeter, they run the full regression against the twin the same afternoon and get a verdict before the end of the day.
The result: Regression runs no longer depend on anyone's calendar. The team ships when the code is ready, and the verdict sits in the release ticket for anyone who asks.

2 · Test what you can't safely break
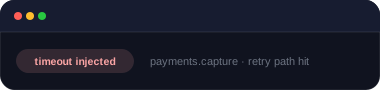
Scenario: The payment provider times out once in a thousand requests, and nobody has ever tested what happens next. The team simulates timeouts, retries and malformed responses on demand, and finds the failure path before customers do.
The result: Failure paths that were guesswork become tested behaviour. The team finds the retry bug in testing, fixes it in a day, and the issue never reaches a customer.
3 · Prove a release is safe to ship
Scenario: Sign-off used to mean chasing screenshots across five teams. Now every run produces a verdict and a ledger, and the evidence exports in one click for the release board or auditors.
The result: Sign-off takes minutes instead of days, and audit questions are answered from the run record, not from memory.

4 · Cut staging spend and ship faster
Scenario: Duplicated staging clusters, vendor sandbox licences and test licences add up, and every release still waits in line. The team moves routine regression onto the ZMeter twin, retires the duplicate environments, and releases more often.
The result: Fewer duplicated environments to pay for, and releases that no longer queue behind them.

06 · Integrations
Works with the systems you already run.
Connect to your toolchain and simulate the enterprise systems your releases depend on.
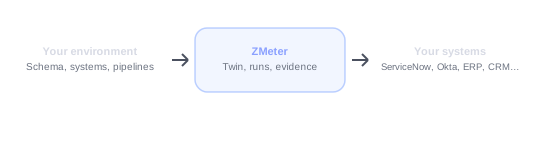
ZMeter fits into the tools your team already uses. Connectors link it to the databases, message queues and file and HTTP endpoints your systems already use, so runs go into real pipelines. Enterprise simulators let you test against the large systems that are hardest to get access to. If something you rely on isn't listed, tell us.
Connectors
PostgreSQL
MySQL
SQL Server
Oracle
MongoDB
Kafka
RabbitMQ
ActiveMQ
Amazon SQS
HTTP
SFTP
07 · Why ZMeter
Why teams choose ZMeter over stitching tools together.
You may already own tools that touch part of this problem. Data tools prepare test data, mocking tools return fixed responses, and load testers measure capacity. Each does its job well, but none of them tells you whether a release is safe to ship. ZMeter is built around that question.
A twin, not a stub.
ZMeter models behaviour and data, so tests reflect how your dependencies actually respond.
Verdicts you can defend.
Every run ends in a clear result and a per-record ledger, not a log file to interpret.
One platform, end to end.
Design, drive, simulate and prove in one place, with no hand-offs between tools.
Production-like data, zero production risk.
Data Studio builds realistic, relationship-consistent data from your schema, so you don't have to copy production data into test.
08 · Security & deployment
Built for teams that take security seriously.
A tool that sits inside your release process has to earn trust before it earns a place there. This section answers the questions your security and risk teams will ask first: where ZMeter runs, what it can see, who can use it, and what proof it leaves behind. Everything below is stated plainly, including what is still on the roadmap.
Audit evidence
Export a full record of every run, including verdict, ledger and timestamps, for compliance and release sign-off.
09 · FAQ
Frequently asked questions.
How is ZMeter priced?
[CONFIRM: pricing model — internal deck positions ZMeter as low cost and priced for teams, no public figures yet.] See the Pricing page for details, or book a demo for a tailored quote.
How is ZMeter deployed?
[CONFIRM: deployment options.] Most teams start in [setup option] and can move to [alternative] later.
Is my data safe?
ZMeter is designed so you can test without copying production data. [CONFIRM: what is stored, masked and encrypted.] Read more in Security and deployment.
Longer answer: Because the twin reproduces behaviour and not records, most teams never need to copy production data into a test environment. Where realistic data is needed, Data Studio generates relationship-consistent synthetic data from your schema. Production data de-identification is on the roadmap. SSO and enforced roles are on the roadmap, and every run leaves an audit trail. [CONFIRM: masking, encryption at rest and in transit, retention]
How is ZMeter different from mocks and load testers?
Mocks return fixed answers, and load testers measure how much traffic a system can take. ZMeter reproduces how your dependencies actually behave, then proves the result with a verdict and a per-record ledger. Teams often use it alongside both.
Longer answer: A mock answers the request it was scripted for, and nothing else. A load tester tells you how much traffic a system can take, but not whether the answers were right. ZMeter keeps state, reproduces how systems actually behave, and checks each record against what should have happened. Many teams keep their mocks and load tests and add ZMeter for the question neither can answer: is this release safe to ship? [CONFIRM: positioning with product]
How long does it take to get my first twin?
Onboarding is included, so you aren't setting this up alone.
Longer answer: Time to first twin depends on how much you can share up front, such as specs, sample data and access. A typical timeline looks like this: [CONFIRM: day 1, connect and share inputs; days 2 to X, twin built and reviewed; first run and verdict by day Y]. Onboarding support is included.
Can ZMeter be customised to our systems?
Yes. Onboarding includes help configuring ZMeter to your systems and workflows.
Longer answer: Every team's systems are a little different, so onboarding is part of the product and not a separate project. The ZMeter team helps you shape twins, scenarios and reports to fit your environment, and you keep control of the result in the console. [CONFIRM: what is included, what costs extra, and who delivers it]
Which systems can ZMeter simulate?
See the Integrations section for the current list. If your system isn't there, request a connector and we'll tell you what's possible.
What's on the roadmap?
We publish what's shipped in the Release notes.
Roadmap items from the internal deck (confirm which may be public): Record and replay is marked coming soon. Next: OpenAPI to simulator, SSO and enforced roles, industry twin kits. Later: multi-table synthesis at scale, production data de-identification, warehouse and object storage, self-serve twin builder.
10 · Demo form
See ZMeter run against your own release flow.
The quickest way to judge ZMeter is to watch it handle a release flow like yours. In 30 minutes, we'll show a run from start to verdict and talk through how it would fit with your pipeline, your systems and your security requirements. Come with a real scenario if you have one.
What the 30-minute demo covers:
- A live run, from connection to verdict
- How a twin is designed for a system like yours
- Security, deployment and pricing, with time for your questions
Prefer to try it yourself? Start free trial / Get sandbox access — just your work email to begin.


